GIS Mapping
Under NDA
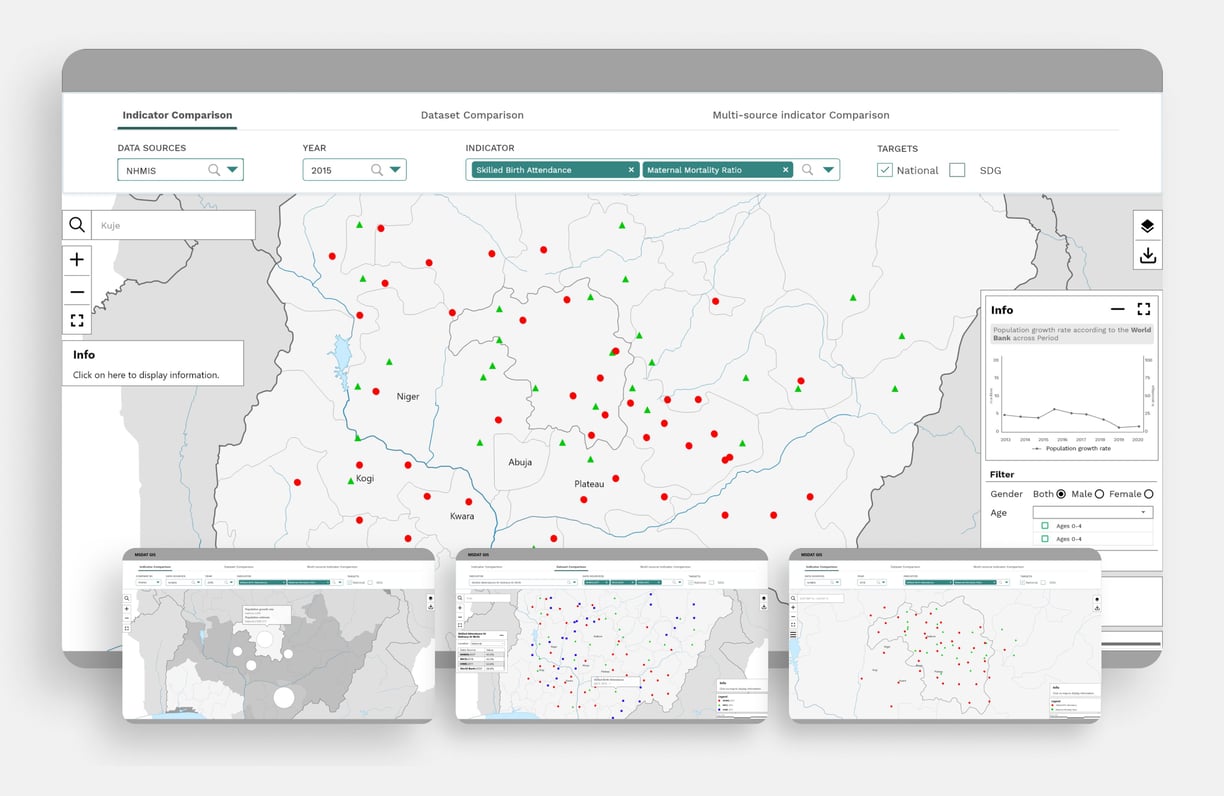
From April to August 2022, I worked as a product designer on a GIS Health Dashboard. I conducted research and explored different concepts while interfacing with external and internal stakeholders.
Take Always
I had the privilege to immerse myself in the world of GIS mapping and its fundamental principles while serving as a UX/UI designer on this GIS mapping project. This experience exposed me to a rich array of resources that significantly deepened my comprehension of this field. Here are some of the pivotal resources that I had the opportunity to utilize:
ArcGIS
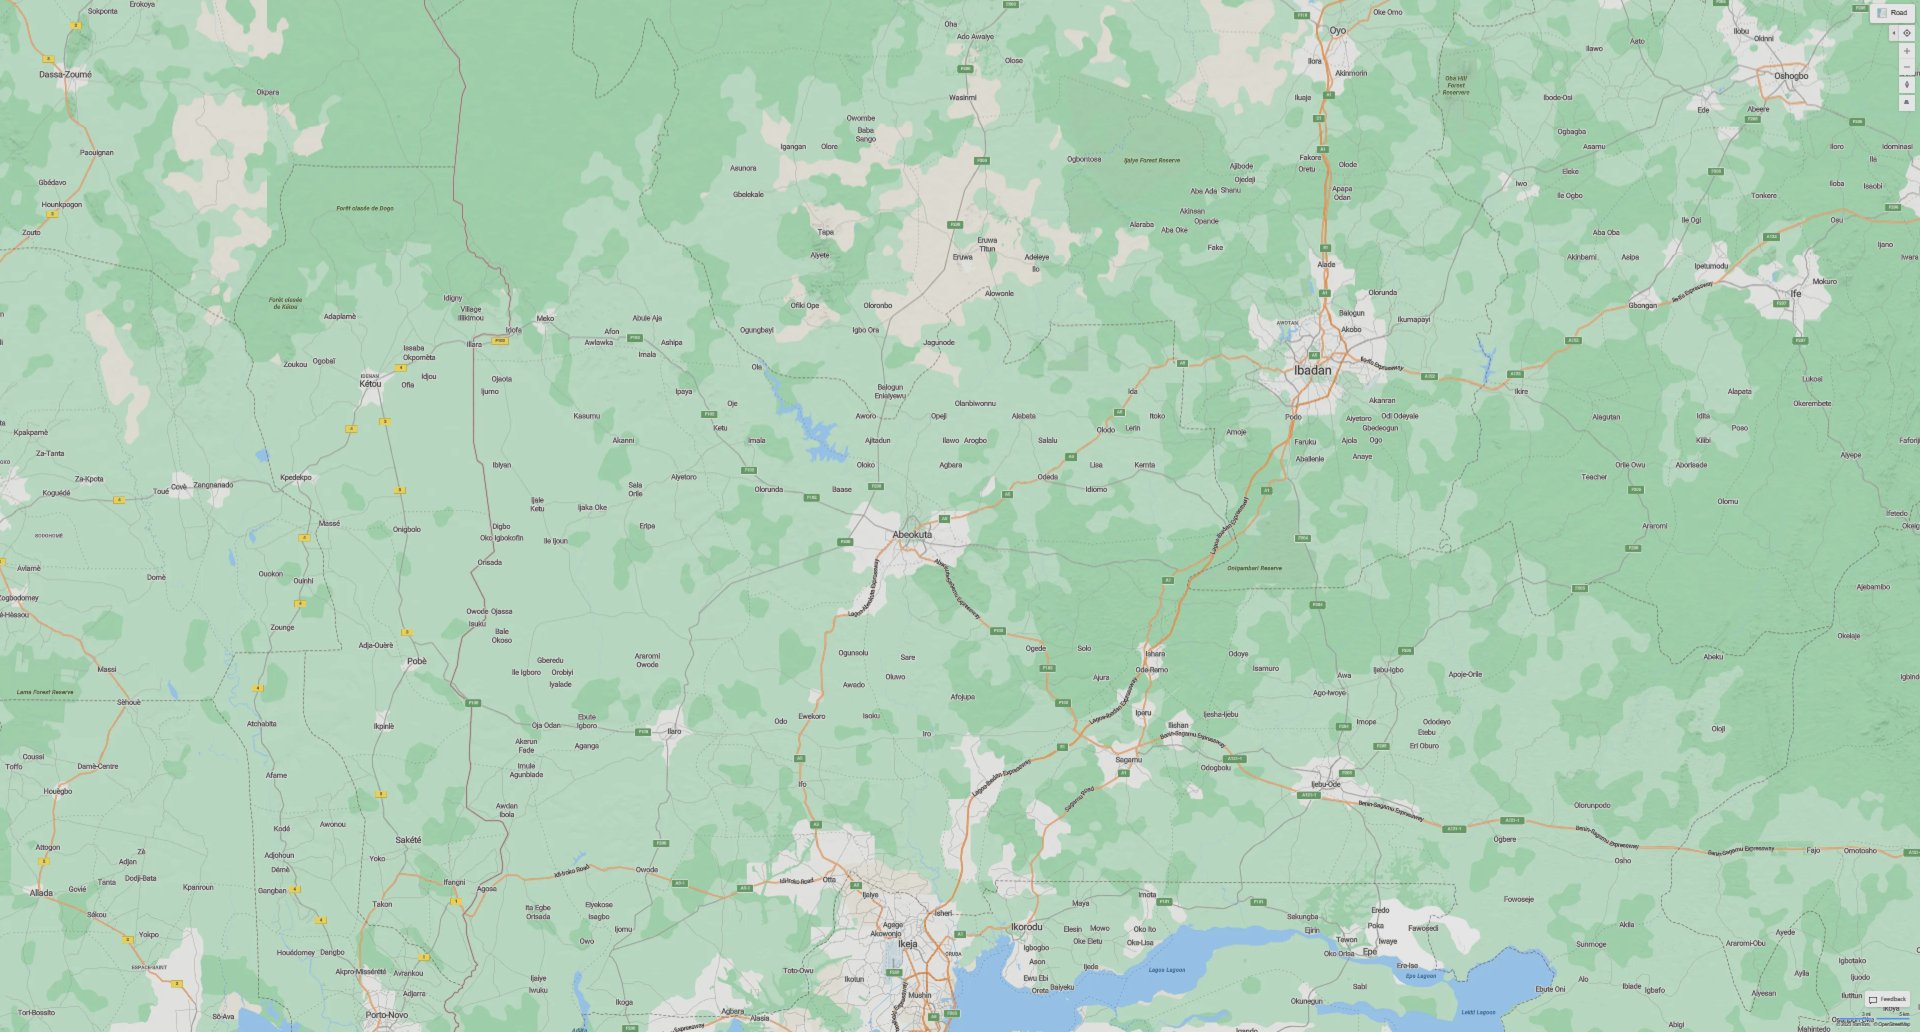
OpenStreetMap
Google Maps
Bing Maps
Grid3
Geopode
Mango Map
The Institute for Health Metrics and Evaluation
Visualizing spatial and spatio-temporal data is a potent means to grasp geographical patterns, trends, and relationships. Below, you'll find a compilation of various map visualization techniques commonly employed for handling spatial and spatiotemporal data:
Choropleth Maps: Choropleth maps employ colour shading or patterns to convey data values within predefined geographic areas, such as countries, states, or regions. They excel at showcasing demographic data or any attribute that varies geographically.
Heatmaps: Heatmaps vividly illustrate the density or concentration of data points using colour gradients. They shine when visualizing point data, such as crime incidents, population density, or disease outbreaks.
Dot Density Maps: Dot density maps employ individual dots or symbols to symbolize data quantities. Each dot embodies a specific quantity, making it ideal for representing point data within a spatial context.
Proportional Symbol Maps: Proportional symbol maps leverage symbols of differing sizes to represent data values at specific locations. These maps come into their own when presenting data like population, where larger symbols signify higher values.
Density Maps: Density maps artfully visualize the concentration of data points in a given area using colour gradients. They prove effective when depicting densely populated urban areas or wildlife habitats.
The selection of an appropriate visualization technique hinges on factors such as data type, objectives, and the narrative you aim to convey. Often, a judicious combination of multiple visualization techniques can provide a more comprehensive understanding of spatial and spatio-temporal data.
I eagerly anticipate the opportunity to delve deeper into the UX aspects of GIS in the near future.
My Role
Please contact me for an interview to discuss my process and outcomes.